Factors Involved In Determining Pump Performance
When working with pumps, you are sure to encounter instances where the pump curve is referenced along with a number of parameters associated with it. A key parameter of the pump curve is the Best Efficiency Point (BEP). For electric motors, efficiency varies with the load, the best efficiency being at about 75% load.
Efficiency is one of the four key parameters to look at when considering pump performance.
- Head
- Flow (capacity or volume)
- Power
- Efficiency
These factors are related to each other by using the following formula:
Power is inversely proportional to efficiency: – the better the efficiency = less power needed. Also, notice that power is directly proportional to FLOW x HEAD (QxH).
For a rotodynamic pump, the flow and head vary depending on the demand of the system. If the system restricts the discharge of the pump, as when a discharge throttle valve is closed, the head increases and the flow decreases. Conversely, less restriction from the system means less head and greater flow. (see the following pump curve diagrams)
See Figure 1.
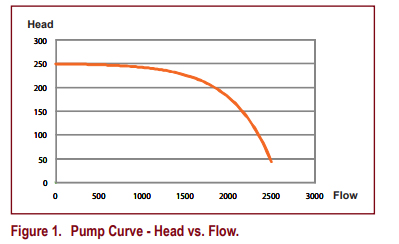
To understand BEP, you have to know that the flow through a rotodynamic pump varies from zero flow at “dead head” (discharge valve closed), to max flow at “run out” condition (no discharge restriction). Efficiency is a function of flow through the pump.
See Figure 2.
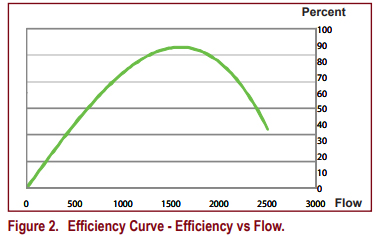
Think of this as traffic on a highway with efficiency measured by the number of cars per minute. The early morning hours, traffic moves fast, but because there are not many cars, efficiency in cars per minute is low. During rush hour, the volume of cars increases and traffic slows, so efficiency is low because cars are moving so slow. Just before rush hour however, could be when efficiency of cars per minute is greatest – which could be described as the best efficiency point for the highway. It’s the same for BEP.
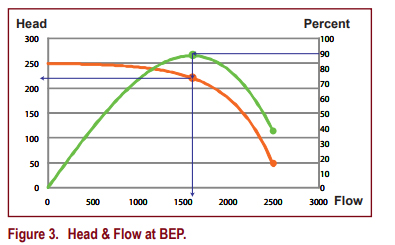
See Figure 3.
At zero flow (discharge valve closed), there is zero efficiency. As the discharge valve opens, flow increases and as a result, so does efficiency. As the discharge restriction is reduced even more, and flow increases, efficiency increases up to a certain point. Past that point, flow through the pump becomes more turbulent, and efficiency decreases as the pump approaches run out condition where efficiency is very low (but not zero). Somewhere between dead head and run out condition, there is a flow rate at which the efficiency is maxed – that is the BEP.
In figure 3, the BEP is indicated at a flow rate of about 1600 units – that flow rate coincided with the max value on the efficiency curve. That flow rate also intersects the pump curve at a point equal to head of 220 units.
It is useful to look at why the efficiency of the pump changes with flow rate. Turbulent flow through the pump plays a central role in determining pump efficiency. The greater the turbulence, the lower the efficiency. So it makes sense that the BEP is the point where turbulence is minimized. The impeller is what imparts the power to the liquid being pumped. Impeller design is one of the most significant favtors in determining the BEP of a pump.
Also, note that trimming or replacing the impeller with a different diameter will alter the BEP for that pump.
Priest Electric has been servicing electric motors and pumps for over 60 years! Please call with any questions regarding your pump performance!
To Contact Us Call: 1.208.459.6351